Visualizations
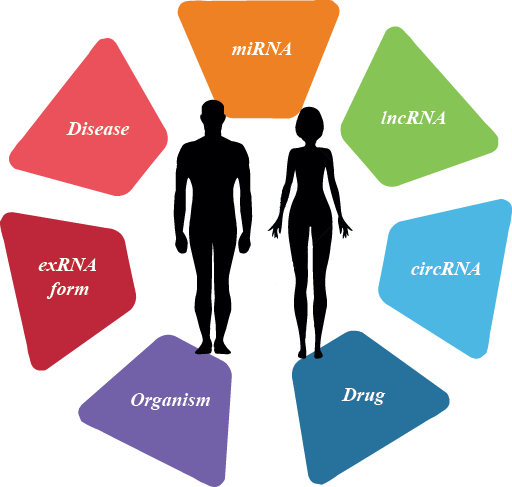
Graphical representation of different data types in miRandola.
Click on the specific term of interest to query the database.
Circos plot for different tumor types.
Here, you can find the disease network representing the RNAs in common for the most representitive tumor types. Click on the disease name to see the full data. (No intersection with Cervical squamous cell carcinoma)
Heatmap representing the RNA-Disease co-occurrences.
The values in the heatmap are the entries in miRandola. Click on the specific cell to see more details.

Heatmap controls
Computer
- Controls:
- Contextual menu
- Left click on rows/columns
- Move heatmap
- Mouse drag over cells or use mouse wheel
- Select rows/columns
- Mouse drag over rows/columns
- Move selection
- Mouse drag selected rows/columns
- Clear selection
- Double click selection
- Zoom heatmap
- Shift + mouse wheel over heatmap
- Zoom rows/columns
- Shift + mouse wheel rows/columns
- Actions (place the mouse over rows or columns) Hide selected Show hidden Invert selection Clear selection Sort by value aggregation
Tablet
- Controls:
- Contextual menu
- Long tap rows/columns
- Move heatmap
- Drag heatmap (one finger)
- Select rows/columns
- Drag over rows/columns
- Move selection
- Drag selected rows/columns
- Clear selection
- Double tap selection
- Zoom heatmap
- Pinch heatmap
- Zoom rows/columns
- Pinch rows/columns